Duty cycle vs duty proxy: what site intensity tells you that an hour meter can't
You know an hour meter can be wrong. It gets reset after a swap, read wrong off a dash in bad light, or just never makes it into the CRM because the tech didn't open the panel that visit. And even when it's accurate, it only tells you one machine's story. It doesn't tell you how the site around that machine is running.
That's the gap between duty cycle and what we're calling a duty proxy.
Duty cycle is a number on one machine
Duty cycle, in the classic sense, is how hard a specific unit works: load factor, idle time, hours under power versus hours just sitting. It's precise when you have it. The problem is coverage. Hour meters live on machines, and machines live behind gates. You get a clean duty cycle reading when a tech is standing at the panel, which means you're always a visit behind on the units you haven't touched recently, and you have nothing at all on units you've never serviced.
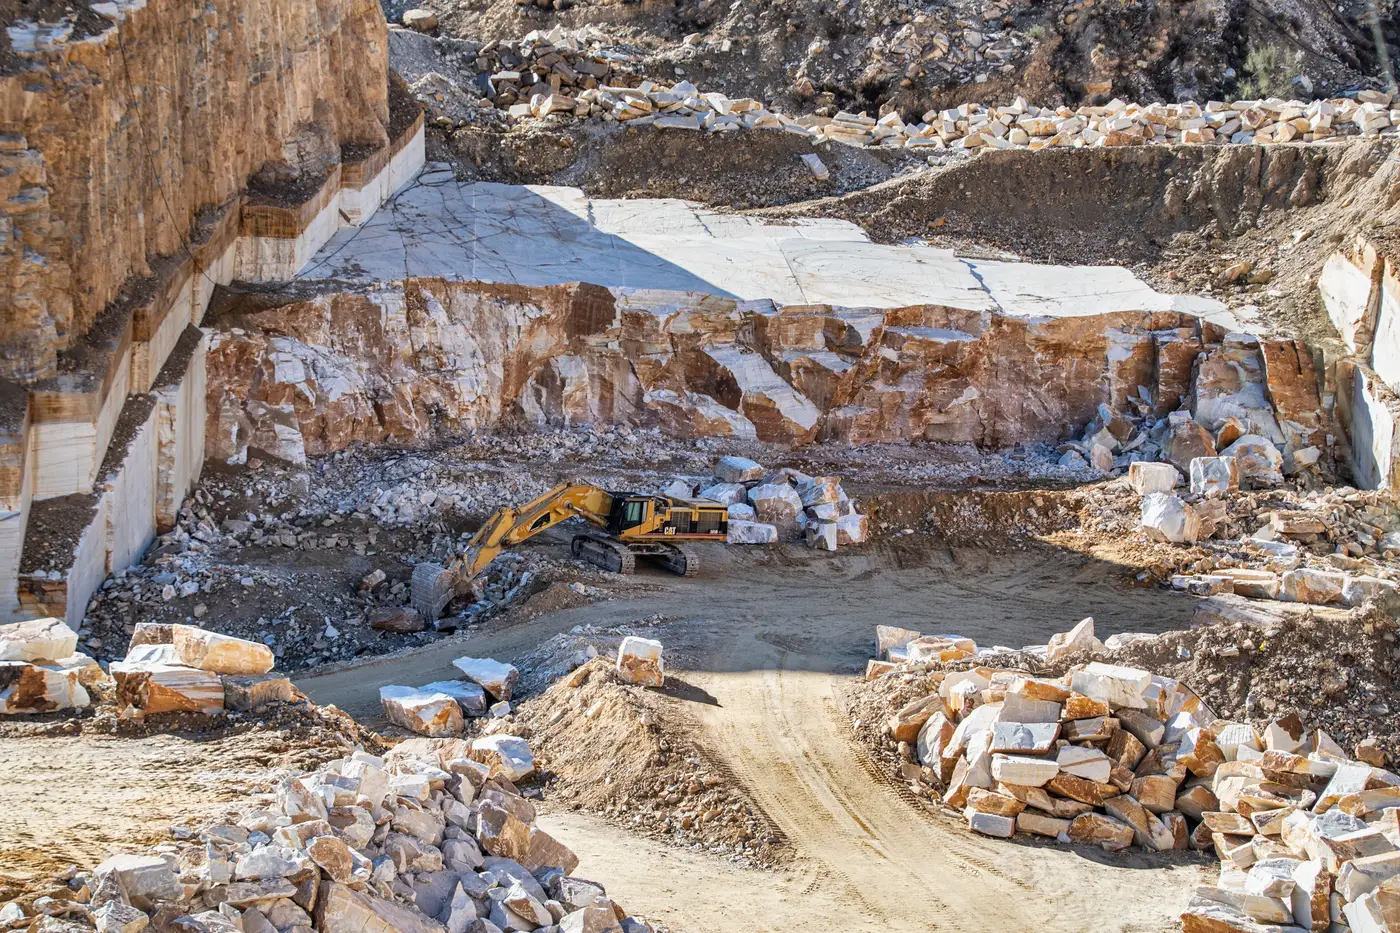
A duty proxy estimates how hard a site is working its fleet by reading the ground itself: how much of the yard shows active work, how much material is moving, how the footprint of activity has changed from one pass to the next. It ranks sites you can't walk onto every quarter, using the same intensity signal across your whole territory at once.
What site intensity catches that the meter misses
Here's where it earns its keep. A quarry that's expanded its working face since last read is burning more fuel, more hours, more undercarriage wear across everything on that site, whether or not any single hour meter has been logged recently. A yard where stacking activity has dropped off might be winding down, which matters for parts forecasting even if nobody's updated a service record. Site intensity is a trend read: more active ground this quarter than last, less active ground, or flat. That trend, run alongside an age estimate on the machine itself, gets you a lot closer to "which fleet is closer to a rebuild" than hours alone, especially on accounts where your hour meter data is six months stale or missing entirely.
It also catches something an hour meter structurally can't: it reads the whole site, not just the unit you serviced last. A fleet of five units on one yard doesn't wear evenly. Intensity trending up across the footprint tells you the whole group is getting worked harder, which is useful even before you know which individual machine is closest to failure.
Where the proxy runs out of road
A duty proxy won't give you engine hours. It won't tell you fault codes, oil analysis results, or which specific unit on a five-machine yard is actually grinding toward a rebuild. It's a sort, not a diagnosis. Treat it as the thing that tells you which territory, which sites, which fleets deserve the call this quarter, then let the hour meter and the tech's eyes on-site do the rest once you're standing in front of the machine.
The combination is the point. Estimated age, this trending-intensity read, and the score components shown rather than buried, refreshed on a quarterly cadence, is what Service Opportunity Scoring is built to hand a territory planner: a ranked machine list per territory that tells you where to send the truck before the hour meter ever gets opened.
If your call list is still built off which site is closest on the map, this is worth a look.